
 Carolin
Faut-il installer quelque chose ?
Non. Slider fonctionne dans le navigateur. Un lien suffit, et tout le monde est là.

Photo de Ayla Verschueren sur Unsplash
Slider est l’outil de présentation où chacun a son mot à dire.
Proposition
Proposition : un chien au bureau

Réunion d’équipe, point 4
3
Diagnosis
Options
Recommendation
Roadmap
PRELIMINARY
Three of nine product lines create 80% of value: shift investment to the upper right and fix or exit Contract Services
SELECTIVELY GROW
INVEST AND GROW
FIX OR EXIT
HARVEST

Market attractiveness (growth, margin pool)

Competitive position
Recommendation

1
Double down on Cloud platform and Analytics.
Together 54% of revenue, 71% of EBIT. Add €18 M capex.
2
Move Integration into the upper right.
Bundle with Cloud, target 15% margin by 2028.
3
Fix or exit Contract Services.
−6% margin, no path to scale. Decide by Q1 2027.
IMPACT BY 2028
+€42 M
EBIT
+3.1 pp
margin
€18 M
capex
Source: segment reporting FY2025, market model (n = 9 product lines), expert interviews (n = 23). Positions as of 30 Sep 2026.
11


Cloud platform

Managed security

Analytics

Field service app
Integration

Legacy hosting

Licences

Contract services

Training
NORDSTADT UNIVERSITY
Faculty of Business, Economics and Social Sciences
Macroeconomics II | Prof. Dr. M. Weber | WS 2026/27
Lecture 7: The IS-LM model
7.3 Equilibrium in goods and money markets
IS curve (goods market)
Y = C(Y − T) + I(Y, i) + G
LM curve (money market)
M / P = Y · L(i)
•
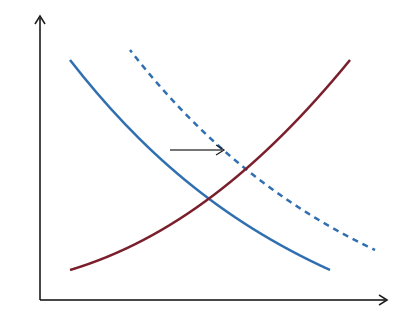
Fiscal expansion (G ↑) shifts IS to the right: Y ↑ and i ↑, private investment is partly crowded out.
•
Monetary expansion (M ↑) shifts LM down: Y ↑ and i ↓.
•
A policy mix can raise output while keeping the interest rate constant.
Exam tip
Always say which curve shifts and why, then label the new equilibrium E′ and both axes.

E
E′
IS
IS′
LM
i
Y
Y*
Y′
Fig. 7.4 Fiscal expansion in the IS-LM model
Reading: Blanchard (2021), Macroeconomics, 8th ed., ch. 5 | Problem set 4 due 18 Nov
23 / 41
i*
i′
HANSEATIC LOGISTICS AG
Annual report 2025 | Investor presentation
FINANCIAL PERFORMANCE
EBITDA rose to €412 M: pricing and network efficiency more than offset higher energy and personnel costs
EBITDA bridge 2024 to 2025, EUR M
380
EBITDA
2024
+46
Volume
+38
Pricing
+22
Network
efficiency
−51
Energy
costs
−29
Personnel
+6
FX &
other
412
EBITDA
2025

Energy: hedges expired in Q2, spot +38%
Segments 2025
EUR M
REVENUE
EBITDA
MARGIN
Contract logistics
1,240
182
14.7%
Freight forwarding
2,010
141
7.0%
E-commerce fulfilment
690
89
12.9%
Group
3,940
412
10.5%
Free cash flow
€198 M
▲ 22%
Net debt / EBITDA
1.8x
▼ from 2.3x
Dividend per share
€1.45
▲ 12%
Guidance 2026: EBITDA €430 to 460 M, capex ~€210 M
EUR M, IFRS 16. 2024 restated for the sale of Nordic Parcel. Figures rounded, totals may not add up.
14
CONSTRUCTION UPDATE | OFFICE CAMPUS NORD
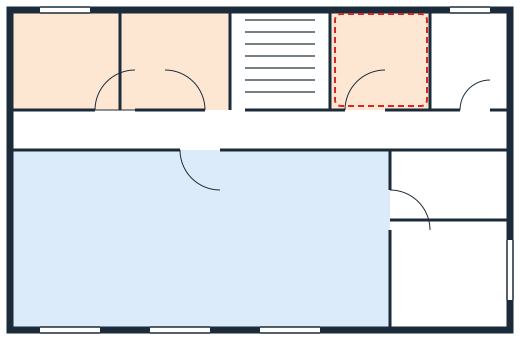
Building B, 2nd floor: fit-out starts 3 Nov, meeting rooms follow in February
Meeting 1
18.4 m²
Meeting 2
18.4 m²
Kitchen
16.8 m²
WC
8.2 m²
Open office | 32 desks
142.0 m²
Server
9.0 m²
Storage
12.6 m²
Corridor
CORE

5.28
5.28
4.80
4.80
3.84
24.00

15.36
REV C

N

0 1 2 3 4 m
LEGEND
Phase 2: open office fit-out, in progress
Phase 3: meeting rooms and kitchen, from Feb

Load-bearing core, shell complete
Rev C: kitchen moved next to the core
SCHEDULE
Oct
Nov
Dec
Jan
Feb
Mar
Shell
Fit-out
Rooms
Handover
today
Office Campus Nord, Building B
A-201 | 2nd floor plan, fit-out
Scale 1:100
Rev C | 12.10.2026
Drawn: Marlon
Checked: Gesa
Site meeting 6 Nov, 08:00 | Hall B entrance
S/4 MIGRATION PROGRAMME | STEERING COMMITTEE 22 OCT
Go-live moves to 2 March: data migration is now on the critical path
Oct 26
Nov 26
Dec 26
Jan 27
Feb 27
Mar 27
Apr 27
WORKSTREAM
OWNER
STATUS
Process design
Ingrid

Blueprint finance
100%
Blueprint logistics
80%
Build
Marcel

Configuration
30%
Interfaces (12 of 31)
10%
Data migration
Paul

Cleansing, 1.4 M records
25%
Mock loads 1 to 3
Test
Lara
Integration test
User acceptance
Cutover
Gero
Cutover and hypercare

Design freeze
Build complete
Go-live 2 Mar

was 2 Feb
Milestones

today
Critical path
On plan
Milestone
Decision needed: approve 4 extra data engineers (€310 k) to protect 2 March
AGRONOMY REVIEW | HARVEST 2026
Field 12, winter wheat: variable-rate nitrogen lifted yield by 0.6 t/ha with 12 kg/ha less fertiliser



Waterlogging in May
−2.1 t/ha

S1
S2
S3
S4
S5
S6

N
Yield, t/ha
6.5
7.1
7.7
8.3
8.9
9.5
10+
38.4 ha | 1,120 yield points | 6 soil samples
Avg. yield
8.9 t/ha
▲ 0.6 vs. 2025
Nitrogen
168 kg/ha
▼ 12 kg/ha
Protein
13.1 %
Quality A
Yield by management zone, t/ha
A sandy loam
8.4
B loam
9.3
C clay, wet
7.4
D loam, slope
9.2
Uniform rate 2025
Variable rate 2026
Crop rotation
2024
Rapeseed
2025
Winter wheat
2026
Winter wheat
2027
Sugar beet
plan
Data: combine yield monitor, cleaned (outliers > 3σ removed). Soil samples 12 Mar 2026. Zones from EM38 conductivity scan.
Hofgut Ellerbach | 6
Photo de Wojciech Wyszkowski sur Unsplash
Carolin
Non. Slider fonctionne dans le navigateur. Un lien suffit, et tout le monde est là.
Photo de Ayla Verschueren sur Unsplash


